Introduction to Return On Management (ROM®) Analysis
Introduction to ROM® Analysis:
Linking Management Productivity and Information Technology
Contents
- Introduction
- About Measurement
- Goal-Setting and Measurement
- The Productivity of Information Systems
- Physical Measures of Productivity
- Problems in Reporting on Physical Productivity
- Omission of Management from Productivity Measurement
- Financial Measures from the Industrial Era
- The Project Authorization Bias
- Post-Industrial Development
- Measuring Management Productivity
- Finding Management Value-Added
- Adjusting for Purchases
- Adjusting for Shareholder Value-Added
- Adjusting for Business Costs
- Computing R-O-M™
- R-O-M™ Diagnosis
- Strategic Business Report
- Management Productivity Report
- Employment Characteristics
Click here to see the Information Productivity™ rankings of 549 companies from 1993.
Introduction
There is no relationship between expenses for computers and business profitability. Similar computer technologies can lead either to monumental successes or to dismal failures.
The purpose of this diagnostic service is to shift attention from information technology to the effectiveness of the executives who manage it. The discovery of the business value of computers lies in their linking with the business plans. Computers on which you run information systems can deliver productivity gains if they are explicitly connected to overcoming existing business problems and supporting competitive objectives. In isolation, they are just pieces of metal, plastic or glass. The contributions of information technologies to increasing the Management Value-added ratio to Management Costs , that is Management Productivity, will tell you if computers produce a business payoff.
Measuring Management Productivity is the key to knowing how to invest in information technologies. Correctly diagnose conditions that will improve Management Productivity before you re-systemize, reengineer or automate. Make management more productive, by electronic means, if you know where, when and how. Automate the business processes that are directly linked to the success of the business.<p>
The Management Productivity diagnostic practice has its origins in studies [Strassmann, The Business Value of Computers] that questioned why the relationship between profitability and computer spending appeared to be random:<p>
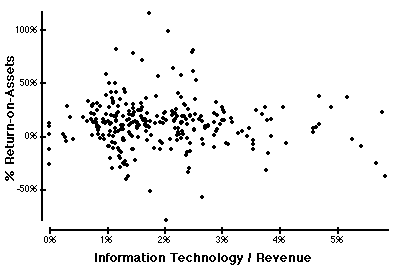
The lack of correlation between information technology spending and profitability is contrary to advertised claims. It defies the common belief that investing in electronic processing of information somehow leads to lower costs and results in competitive advantage.
Should these findings create doubt about the rapidly rising computer budgets of the last 30 years? Without good answers as to how to validate their gains, corporate executives kept voting with their check books to automate their activities on a scale that exceeded in scope and speed anything in history. Computer budgets increased faster than purchases for any other class of equipment and now exceed the profits for half of the firms that employ them. Failing firms did not lag behind superior firms in the rush to install the best and latest computing equipment. There are unprofitable companies that spend more money on computers than similar firms that realize large profits. Does that signify that the decisions to purchase information technology is unrelated to results? Research, on which this diagnostic method is based, suggests that corporate over-achievers differ from under-achievers. They also manage their computers differently.
Conventional financial ratios are unsatisfactory for measuring the benefits of information systems. Companies competing in equivalent markets, with a similar capital structure, with comparable production technologies and the same computer models can deliver remarkably different financial results. This diversity is attributable not to computers but to Management Value-added. Since the management of information is inseparable from management's general roles. We view the processing of information by electronic circuitry as an extension of traditional management roles, by other means.
This diagnostic methodology is addressed to those executives who are trying to extract business value from their investments in computers. After applying it, clients should have greater confidence in deploying information technologies in assisting their organization to achieve its goals.
About Measurement
GOAL-SETTING AND MEASUREMENT
Misapplications of technology occur when goals and actions are confused. Organizations launch projects for "giving personal computers to all salespersons," "automating clerical labor," "converting from batch-processing to on-line systems," "introducing artificial intelligence into decision support applications" or engaging in the building of an "executive information system." By not separating the validity of goals from the implementation, the conflicts between ends and means will confuse even the best-intended schemes.The problem is that complete goal-validation, such as a detailed commitment to getting specific benefits, is a painful process. The appraisal of a particular goal is possible only if the goal is clear, measurable and supported by verifiable cases. Most importantly, verifiable goals specify how we will measure the result of our efforts after we complete the intended project.
Coming up with proof that the desired goals were reached is a tough assignment. That is hard to do, especially if the proposed technology project needs support from constituencies who have conflicting needs, opposing interests and diverse qualifications in considering the merits of the proposal. In the public sector, such projects are carried by contention between competing Agencies. In the business world, they are compromises arising from the annual budget process which favors the dressing up of goals into acceptable projects. Unless an information technology has measurable financial outcomes, the clarity of its goals is questionable.
When you introduce computers into an organization, their effects are systemic, affecting the working of the whole company. The consequences will modify the way the firm operates. Because of this, measurements must reflect the aftereffects of many changes, instead of just one isolated improvement. It is relatively easy to achieve simple goals by sacrificing others. The effect of increasing market share will ripple through every Department. Production, personnel, manufacturing and distribution functions never will be the same. This raises the issue of goal-setting for information technology investments: what principles help us examine a proposal for changing systems that manage an organization?
The answer is that you should measure the productivity of organizations before and after automation. Gains in organizational productivity would tell us if the new system improved overall performance, because the overall advantages outweigh the overall disadvantages. What then is the meaning of organizational productivity in an information-based company?
THE PRODUCTIVITY OF INFORMATION SYSTEMS
The term productivity is about two hundred years old. At the start of the industrial revolution, factory owners needed a quick way to assess operating results without having to wait for financial reports. Productivity was output divided by input. For example, if a blast furnace produced 10 tons of steel per worker, and next year the same furnace produced 11 tons of steel per worker, labor productivity increased by 10%.PHYSICAL MEASURES OF PRODUCTIVITY
Under the influence of Frederick Taylor the measurement of efficiency and productivity came to the factory floor. Productivity was re-defined as the physical output produced with a given number of physical inputs. For example, the number of shafts, bearings or carburetors produced per work-hour or man-week would be a measure of direct labor productivity. The whole idea of physical productivity also applied to national economic measurements. Today, U.S. productivity is a weighted mix of physical outputs (tons of steel or paper, kilowatts of electricity, etc.) divided by a weighted mix of labor inputs, such as hours worked. In addition, national productivity includes an allowance for capital inputs, such as the reported financial value of physical assets.This measurement of productivity was satisfactory when the country's main economic activities were agriculture or manufacturing and when physical outputs were comparable to similar physical inputs at an earlier time. A bushel of wheat or a ton of pig iron did not change much over the period when comparing productivity results.
During the 1930's quality began to displace quantity as a critical factor in advanced industrial economies. As a result, imperfections in the measurement of productivity started creeping in. Automobiles and convenience foods sold in 1960 or 1970 were not equivalent to those produced in the 1930's or 1940's. The labor-intensive assembly lines of the pre-World War II factories were not comparable to the highly engineered production processes thirty years later. Accurately measuring gains for the number of automobiles or tons of freeze-dried vegetables could not be done, because dissimilar outputs were produced with different inputs. Similarly, a computer in 1989 is not comparable with a computer in 1979 or 1969, regardless of how we try to define their equivalence in millions of instructions per second per dollar.
PROBLEMS IN REPORTING ON PHYSICAL PRODUCTIVITY
After 1970, serious difficulties in interpreting productivity numbers began to surface. In advanced industrial societies, the manufacturing sector declined as the origin of Value-added shifted from production (reported in the manufacturing sector) to distribution (reported in the service sector). When a steel company shifts its warehousing to a distributor, this appears as a loss to the production sector and a gain in the services sector.The automation of a factory reduced the direct labor force, and therefore presumed to improve productivity. But, for every factory worker displaced, there were now two other people employed in the company's offices. These changes appeared in corporate productivity calculations as gains in manufacturing productivity. The offsetting productivity declines from office work did not get reported, because no means were available for measuring the outputs of the rising office population. You had inputs (office costs) but no easily identifiable outputs. Without output estimates you cannot come up with useful measures of productivity.
Some banks and insurance companies have re-organized themselves on the model of paper-work factories. They began measuring the productivity of clerical personnel using the principles of industrial management. Detroit time-and-motion study engineers found employment in New York offices when computers were introduced on a massive scale. The industrial engineers succeeded only in streamlining clerical labor. They failed in dealing with the rising costs of professional staffs which were excluded from productivity calculations because their output was intangible.
The traditional formula for determining "productivity" as a critical business indicator was at a dead end. Nobody knew how to calculate the gains, if there were any, caused by the growing costs of information work. Without a generally accepted correct measure of productivity, you could not support massive investments in computers. The stage was set for the approaching decline in the seemingly unlimited appetite for more information technology.
OMISSION OF MANAGEMENT FROM PRODUCTIVITY MEASUREMENT
The fastest rising and the most expensive labor costs - executives, managers, administrators, professionals and officials - whom I designate as Management, were omitted from all productivity calculations. Management was overhead, with "intangible" and "immeasurable" physical results, and therefore had been exempt from the measurement of their outputs. "White collar" productivity studies concerned only the work products of clerical and secretarial personnel. It was acceptable to claim savings from reducing fully burdened clerical and secretarial labor hours, even if this added to the size of managerial and professional staffs.The widespread adoption of computers made the misjudgments of productivity only worse. Computers generated outputs for which internal customers often did not pay. Computers also supported people delivering intangible advice to Management, whose output also was intangible. This meant that the economy began absorbing large quantities of information-processing capital unrelated to the generation of profits. Legions of specialists attending to the needs of overhead personnel joined the payroll. Productivity was no longer the traditional concept of a ratio of physical outputs to inputs. Output was indeterminate and input was an untraceable overhead expense.
The first twenty years of euphoric acceptance of computers ended when overhead costs (including supporting capital) surpassed direct labor costs (including their supporting capital) in the service sector. Since the immeasurable became the largest input, physical productivity ratios ceased to have any meaning.
FINANCIAL MEASURES FROM THE INDUSTRIAL ERA
Because there were no valid measures of productivity, investments in computers were justified only in strictly financial terms. Corporate procedure already was familiar with filling out similar forms for the approval of fork-lift trucks, the building of warehouses and the buying of a new milling machine. Forms for acquiring information systems also took on the same appearance. These forms are much alike, regardless of the industry or the country. They differ only in detail as to calculating and documenting ROA (return on assets) or ROI (return on investment).Every method for computing ROA or ROI goes back to the eighteenth century, when capital was the most important element in organizing the industrial means for production. According to this view, all profits created by a company are possible because of capital. Labor was a commodity. Management was overhead to the costs of labor. Therefore, ROA and ROI are the essence of free-market as well as planned economies, for they calculate the efficiency with which you use capital. Following this outlook, the financial analysts, the stock market and your shareholders will judge you primarily by your capital efficiency and not by the efficiency of how you utilize your human resources.
To come up with the financial measure of productivity is simple: you divide profit (the final output of any enterprise) by capital (the decisive input to any enterprise). Labor, management, land and material inputs are bought at commodity prices. What counts then, is capital. If capital is well invested, you get productivity.
This explains why management theorists until now have been primarily concerned with the efficiency of using capital. That was acceptable prior to the introduction of huge administrative staffs. Management's concentration on capital budgeting was essential. The capacity to manage capital resources meant having access to more capital for large plants to produce steel, refine oil, generate electricity and make appliances. An adequate supply of inexpensive capital was a prerequisite for gaining market share through production and distribution efficiencies. The fascination with the acquisition and management of capital obscured the understanding that the annual costs of corporate bureaucracies were becoming more expensive than the annual carrying charges for capital assets.
THE PROJECT AUTHORIZATION BIAS
The concentration on capital investment changed the ways of managing innovation. Management focused on capital budgeting as the place where they could exercise maximum influence over the future directions of a business. Once a capital investment was approved, the operating expense would then follow from the initial investment decision. Therefore, the annual costs would not be amenable to major changes. As a consequence of such thinking, all innovation required estimation of expected benefits and costs with reasonable confidenceWhen such investment-oriented logic was applied to computer projects, it resulted in elaborate, lengthy and tortuous approval procedures. In the absence of reliable productivity measures industrial-age executives became convinced that the preferred way to control computers was through project authorization procedures which reduced the risks of computerization to a minimum. This resulted in favoring projects that automated existing business procedures instead of changing them to take advantage of the new information-handling methods. Investment-oriented executives failed to recognize that computerization is an incremental, continuous and evolutionary organizational learning process that requires better controls over operating results for the entire business. Cumbersome project review procedures produced elongated development schedules, and created a tendency to combine long overdue incremental improvements into a single costly project. Emphasis on controlling new investments led to the establishment of the information system as a discrete and separate function, instead of integrating it into every manager's job.
Executives who rely primarily on project authorizations to control computer spending are focusing on a diminishing fraction of total costs. As soon as the annual growth rate in information technology spending slows down below 10%, less than 20% of the total budget would be available for new development. The rest of the budget goes for ongoing maintenance and inflationary salary increases. The share of capital expenses for any new information technology development is also very small, because most of the cost of installing new applications is in systems analysis, coordination and training. Relying on project authorizations of information technology hardware investments as the principal method to guide the application of computers becomes irrelevant.
POST-INDUSTRIAL DEVELOPMENT
By 1980, global competition created excess production capacity for nearly every product or service. Rapidly accumulating profits were seeking out opportunities for re-investment. The globalization of financial markets created conditions where capital became a readily traded commodity, not a scarce resource. Hundreds of billions of dollars moved electronically, on a moment's notice, from country to country whenever there was a small change in the price of capital. When international financial transactions exceeded international trade by a multiple of 20 or more, finance capital ceased to be the prime explanation for value creation. Capital was now a commodity, like everything else.The scarce resources today are people who can organize and motivate the productive capacities of their employees, and who know how to maximize the use of capital. The scarce resource of the post-industrial world is Management. If a company is profitable, this is because of Management, and not because of capital. One can determine Management costs by first identifying all Operations costs, which are all resources that are essential for serving today's customers. Everything not in Operations is, by definition, Management:
    Operations                      Management
  How to do                       How to organize
  Doing the things right          Doing the right things
  Today's business                Tomorrow's business
  Structured tasks                Unstructured tasks
  Today's decisions for today     Today's decisions for future
  Workflow shapes decisions       Decisions shape workflow

The Characteristics of Operations and Management
Companies in the same industry, with the same technology and same capital
structure, can have widely differing profits. research found that high capital
intensity is always harmful to profitability. Therefore, measuring business
productivity only by means of capital productivity ratios will not reflect the
real causes for generating profits.The modern enterprise employs large numbers of computer-supported managers. Measuring its capital productivity will not tell us much about this critical resource. Measuring the productivity of its direct labor is also insufficient. Reporting automobiles produced per worker per year does not tell us much about what cars are being produced with robots. Boasting about gains in clerical productivity will be equally misleading.
If management is the scarce resource, and if management is the key to the productivity of organizations, why not measure "management productivity" instead of "capital" or "labor" productivity? This approach would be different from the way today's economists or accountants think about evaluating business results.
Most importantly, measuring Management productivity would open the way to exploring the benefits of computers used by their principal customers, the managers of information.
MEASURING MANAGEMENT PRODUCTIVITY
The measurement of organizational productivity is only possible if we consider how well a firm's leadership guides the business so that the employees' contributions remain constructive. How well management manages, over an extended period of time, is the aim of measuring Management productivity.From a shareholder's standpoint, management - not capital - should be the investment that needs watching. From the shareholder's standpoint, the only evaluations that make sense concern the effectiveness of management. Management productivity answers the following question: for every dollar spent on management, how many dollars of net gain accrue to the shareholders?
Computers primarily serve management and control purposes. Because the use of information technology is not evenly distributed among workers, we can get a better understanding of its effectiveness by separating its managerial uses from other applications. We can then evaluate the effectiveness of Management with or without computers. We can also isolate cases showing superior managerial productivity, and then examine their characteristics of computer use that differ from cases that show inferior managerial productivity.
Research extending over a period of 10 years led to the concept of Return-on-Management™. This ratio does a good job not only in evaluating information technology, but also in identifying excessive overhead costs. This ratio is calculated by first isolating the Management Value-added of a company, and then dividing it by the company's total Management Costs:
Return-on-Management™ = F(Management Value-added,Management Costs)
Management Value-added is that which remains after every contributor to a firm's inputs gets paid. If Management Value-added is greater than Management Costs, you can say that managerial efforts are productive because the managerial outputs exceed managerial inputs.
Another way of looking at the Return-on-Management ratio (R-O-M™ Productivity Index) is to view it as a measure of productivity. It answers the question of how many surplus dollars you get for every dollar paid for Management.
R-O-M™ Index = F(Management Output,Management Input) = Management Productivity
To attribute all surplus value to Management, instead of capital or labor, is a departure from classic economics. It is Management that makes the investment and pricing decisions. It is Management that motivates the employees. It is Management that chooses products and markets. It is Management that organizes the suppliers and the production and delivery of goods to customers. Good Management can get more of the capital it needs, at a lower interest, than poor Management.
The scarce resource of contemporary society is not capital or technology, but Management. The time now has come to begin measuring it explicitly. Management Productivity is not apparent from capital-based financial ratios that only tell us something about Management by proxy.
The theory behind this concept comes from the idea that information (e.g., Management) is a disorder-defying phenomenon which assures survival of a firm in a competitive environment. Without the continuous intervention by Management every enterprise must perish from chaotic conditions which arise when external information (about customers and competitors) and internal information fails to guide people in what to do. When that happens people cannot cooperate in bringing in new revenues.
According to laws of thermodynamics, machines always produce less energy than they consume. Management has the capacity to construct a device - an organization - that extracts from a hostile environment Net Value-added (Outputs) in excess of total costs (Inputs). A well-managed organization is superior to any engine ever invented. A profitable corporation generates a net surplus of wealth. For effective organizations, Output always exceeds Input, which defies the law of physics that states that this is impossible and disorder must ultimately prevail. Our civilization has created an enormous accumulation of wealth, because Management has learned how to increase cooperation through organization of its productive resources.
How to measure a phenomenon that must generate a positive Net Value-added to survive is central to the issue of what Management is all about. For the last two hundred years, management was evaluated by its capacity to extract new surplus (profits) out of past accumulations of profits (invested capital). Since smart management can get all the capital it can use, the old formulation can now be replaced by directly measuring the productivity of Management as an information-processing function. We measure the Output/Input ratio by finding what's left after Management pays everyone, and dividing that by the costs of managing the Net Value-added creation process. This is why it is critical to find how much information (Management) is necessary to run an enterprise.
Companies that can extract more Net Value-added from the marketplace, while consuming less information to accomplish this feat, will be the winners. The question of what is information effectiveness resolves into finding how much Net Value-added can be created with the smallest combination of managers and computers. Measuring Management Value-added is then the key to evaluating organizational performance and to measuring the effects of computers on management information systems.
FINDING MANAGEMENT VALUE-ADDED
Finding the Management Value-added is similar to extracting gold from rocks or river sand. First, you sift out large pieces of matter that clearly do not belong. After that, you do not assume that whatever is left is gold because there is still too much extraneous matter. You concentrate on removing foreign material, making sure that in the process you do not accidentally discard anything that is valuable.Management Value-added is the purified residue of a winnowing process. You obtain it if you have exercised good care in removing all variables that do not belong.
ADJUSTING FOR PURCHASES
As the first step in the cost-separation process, remove from Revenues the costs of Purchased Raw and Finished Materials, Parts, Energy and Services. These essential inputs are managed by somebody other than the firm's management. Their prices already reflect the suppliers' management costs.Next, subtract the cost of Interest.. Interest payments are just like payment for any other service. In this case, the supplier is usually a bank. Effective management will pay less for loans than an unreliable one. What matters is the incremental Value-added that management creates with loans. In this respect, the money that management obtains is not different than any other rental contract for equipment or services.
Next, subtract all Taxes. Profit after taxes is the indicator that matters to the shareholder. Subtract taxes directly from revenues - before, not after other expenditures - because government makes sure it gets paid before anybody else. In this way taxes become payments to the most insistent supplier. All taxes are then an involuntary purchase. Allocation from headquarters is also a form of imposed taxation and must be subtracted from Revenue. What remains is the Business Value-added.
It is revealing to examine the enormous range in Business Value-added as a percentage of Revenue for manufacturing firms:
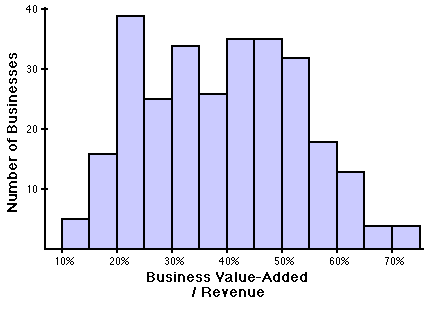
In our analyses all productivity evaluations will be based on Business Value-added instead of on Revenue, because companies with a high degree of vertical integration (a high Business Value-added/Revenue ratio) can justify more Management than those with a lower level of integration. Productive executives are likelier to make better choices on the mix of what to buy and what to make. They can then support the additional costs of coordination and integration, provided that the incremental value-added is greater its incremental costs.
Superior management also can get better prices for their purchases. This translates into improved Business Value-added. Choosing efficient suppliers, especially in manufacturing, offers the greatest possible opportunities for profit improvement because purchases will be the largest cost element. Value-added analysis becomes the key to judging the worth of computer investments that support buying activities.
Focusing on Business Value-added gives an unobstructed view of the scope of a firm's managerial activities. It is unfortunate that accounting practices fold into the cost-of-goods an indistinguishable mixture of direct labor, production overhead and purchases so that it is hard to tell whether the company is increasing or decreasing value-added. For value-added analysis, you must first extricate from the cost ledgers external purchases. Clients used to value-added concepts do not have these difficulties, because taxation rules dictate value-added financial reporting as a matter of routine.
ADJUSTING FOR SHAREHOLDER VALUE-ADDED
After paying suppliers for their share of inputs, Management has to account for the shareholders' value-added. The major distortion in the Return-on-Asset calculations is that ROA for low-debt businesses will be higher when compared with high-debt businesses. Calculating the R-O-M™ Index adjusts such comparisons by subtracting from the Business Value-added the going rate of the costs of shareholder capital, multiplied by the market (or book) value of shareholder equity. This calculation is identical with the current approach to calculating the cost of capital for the Economic Value Added (EVA).Subtracting the going rate of shareholder capital costs from after tax profits is another way of computing the economic "rent" for capital. It is also known as the "economic profit" of a firm, which is different from the usually quoted number known as "operating profit." According to this view, shareholders' economic profit, or economic rent, is equal to operating profits minus interest costs, minus the investment revenues a company's assets could earn if employed elsewhere. Such rent can be also calculated by estimating the breakup value of a firm, and multiplying that with an interest rate that can be earned in a comparable investment.
Regardless of the technique used for computing the shareholder Value-added, it is essential that it reduces reported accounting profits. Otherwise, the financial reports overstate the contributions by Management and could end up paying bonuses on Value-added which rightfully belongs to shareholders.
ADJUSTING FOR BUSINESS COSTS
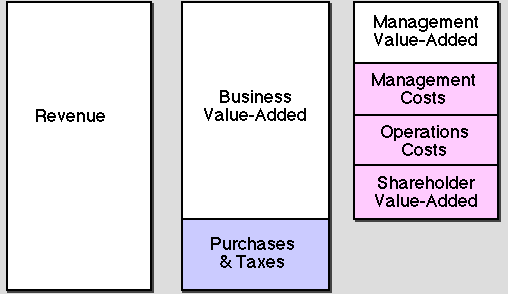
Day-to-day Operations are paid for next. These include the fully burdened costs of employee payrolls, asset depreciation and interest. Operations include everything that is essential for getting today's goods and services produced and delivered to today's customers.Management Costs are calculated by considering that everything that's not in Operations automatically is placed in this category. The Management Value-added is Revenue minus Purchases minus Shareholder Value-added minus the Costs of Operations minus the Costs of Management.
The following diagram should help in understanding cost elements for deriving the Management Value-added:
In favorable cases the Management Value-added can be a large multiple of Management Costs. There are firms where for every dollar paid to Management, they create two or more dollars of surplus Management Value-added. The unhappy aspect of Management Value-added is that it can be less than zero. Over 20% of firms showed a negative Management Value-added, although more than 50% of those still report profits and a positive R-O-A, using generally accepted accounting principles.
Computing R-O-M™
Data-gathering begins the process for computing standard performance indicators. Each of these indicators has been tested to give statistically valid correlations about the relationship between the structure of management costs and business profitability. The first Part is an outgrowth of empirical work done since the early 1970's at the General Electric Company, the Strategic Planning Institute (PIMS) and now continuing at the MANTIS (Management Tools and Information Services, Inc.) research consortium .Part 1, Critical Characteristics is identical with the short form of strategic analysis as used by the MANTIS organization as a Strategic Business Analysis report. Clients may opt to fill out a more elaborate questionnaire to get more diagnostic indicators dealing with matters of marketing strategy.
Part 2, Management Productivity Characteristics will collect data needed to compute the value of R-O-M™ and to come up with insights about the effectiveness of overhead expenses.
Clients may also wish to apply R-O-M™ techniques in analyzing major investment proposals involving information technologies. A Functional Economic Analysis package and a risk-analysis service is also available.
R-O-M™ Diagnosis
The aim of the Return-on-Management diagnostic process is to imitate practices well established in confidential medical testing.The findings will not produce specific action recommendations. Taking historical statistics and from that generating a specific prescription what to do is not feasible. The goal is to offer well-researched ratios which compare a client's actual business characteristics against a range found in comparable organizations. The goal is diagnose those distinctions that suggest what may be detracting from the capacity of a business to reach its profit potential.
In sound medical practice clinical testing always precedes the prescription of a specific therapy. The same approach applies in dealing with managerial pathologies. Information technology should not be examined as a machine tool but as a pharmaceutical. With proper diagnosis, the right timing and the correct dosage pharmaceuticals can produce miraculous results. If applied incorrectly, they can kill you.
COLLECTION OF STANDARD DATA
To get comparable data across a range of industries and in different countries, all data definitions are standardized. Most of the information called for in filling out these forms is routinely available from existing accounting data and from marketing research sources.The R-O-M™ data form requires to split costs for creating the customer value-added from costs incurred in supporting the delivery of products and of services. The forms also instruct how to allocate information technology costs to business functions. To document how the original accounting data is distributed create a spread-sheet which tracks all changes.
When a client experiments with R-O-M it is sometimes possible to take a few short-cuts. For some industries I have enough purchase-to-revenue ratios so that, my computer can estimate the likeliest total value-added. If this approximation turns out to be important I will ask for the actual purchase costs.
Though the data-gathering forms should be self-explanatory analysts will need help in interpreting some data definitions. They also may have difficulties in discerning what is the called for accuracy of a few non-accounting numbers. Clients have direct access to me either by facsimile, by telex or by electronic mail to resolve any questions without much delay.
COMPARISON AGAINST A DATA BASE
From many case studies we have identified correlations between the R-O-M™ measure of productivity and critical performance ratios. Some of these insights come from research that has its origins in the PIMS studies about business strategy. Studies about the relationship between overhead costs and information technology are derived from work done under PIMS auspices (the MPIT project), and from client engagements.After receipt of the finished management productivity forms the data will be compared with the data-base for a data-consistency check. Out-of-limit conditions are identified and the client is contacted to find out whether the deviant information should be included in the diagnosis. Critical performance ratios are then calculated from the accepted data and results compared with information in the R-O-M™ and MANTIS data bases as well as against constantly updated research findings. Great care is taken to assure statistically reliable comparisons. To that end we recognize differences by industries (by major standard industry classification categories), differences by geographic location (USA and Canada vs. Europe), differences by taxation, differences by capital structure (the debt/equity ratio) and differences in the costs of equity capital.
If a client's case is unique I shall refund half of the fee and the client will be mailed a comprehensive report showing why he is incomparable.
The entire diagnostic method relies on annual critical performance ratios and therefore, the results are indifferent to changes in currency or in inflation. When the annual data contain unusual one-time costs, such as in case of atypical marketing programs, a discounted cash flow model will compute equivalent annual costs.
For large multi-divisional companies comparisons can be made both against the general data-base and against a customized data-base if there is a large sample to make the additional analyses statistically significant.
SECURITY
The extreme sensitivity of the input data and of the diagnostic results call for precautions equivalent to the handling classified military information. The following practices safeguard the client's data:* The client will be given a randomly picked block of identification numbers. After that all forms, communications and final reports carry only that number. If a Client makes an unintentional disclosure all the compromised information will be returned for re-submission in a different format.
* Clients may wish to disguise his costs by multiplying or dividing every number by a constant. For instance, Swedish data can be converted into Italian liras.
* Clients should submit their data forms through a third party to prevent accidental disclosures. This procedure works well when the data gathering and diagnostic interpretation is done by third parties, such as a trade association or the corporate staff of a multi-divisional company.
* All forms, final reports and all interim communications are transmitted by registered mail. Facsimile transmissions of data need verbal authentication at both ends.
We are following the same rules as on the PIMS project, where detailed financial information about more than 2,000 businesses were accumulated over twenty years without compromising security.
Strategic Business Report
The first thirteen forms in the Management Productivity collection assemble the key descriptors about the competitive health and about the financial fundamentals of a business.Where accurate numbers are available, such on some line items in the financial statement that is preferred. Where no accurate numbers are available, such as for the competitors' market share or product quality, the best estimates by knowledgeable observers are enough. Where even estimates are difficult to make a neutral answer is better than no answer. The chances are that many estimates may not influence the diagnostic findings . If the neutral answer appears as an important difference then more effort is required to find out the right descriptor.
Usually, it will take about three hours per Strategic Business Unit (SBU) to complete the forms with adequate precision to check out the adequacy of the information.
In filling out the forms, a few rules are in order:
* The form should be finished for each Strategic Business Unit in a company. An SBU is defined as a coherent strategic entity (i.e., a well-defined product line going to a well-defined market). It may or may not follow the lines of Divisional organization. It may share factories or marketing resources with other SBUs . If in doubt about how many SBUs should be recognized choose the smaller number.
*. Where accounts need to be allocated to the various SBUs a simple formula is always preferred to a complex allocation scheme. The moderate differences that my be produced by more complicated formulas usually have little effect on strategic diagnosis.
* Usually, the allocation of assets, of joint production equipment, or of joint costs across SBUs can be done on the basis of value added. Allocations based on revenue should be avoided unless there is defensible logic behind such an approach. All support costs--and this applies especially to research, engineering, systems support and to programming maintenance--should be allocated using estimates of the resources consumed and not using unrelated ratios, such as employee headcount or assets.
* Market-related questions must focus on the served market of the SBU. The served market is that segment of the potential total market in which the business is an active competitor which means having a competitive product and making an identifiable marketing effort. The relative ranking of the business and of its competitors (as defined by market shares, relative prices, innovation and relative quality) must be judged with reference to a well-defined served market. I find that this part of the diagnostic forms gives the greatest problems to my Clients, because they tend to forget the distinctions what is the total market and what parts they are participating in.
The first thirteen data forms supply information that generates the Strategic Business Report diagnostic report which is designed to monitor the competitive health and future financial prospects of the business. This diagnosis is based on extensive empirical research of businesses with similar strategic characteristics.
The Strategic Business Report represents the simplest level of analysis. It is designed as a communication tool for the CEO, CFO and for the business management team. Its purpose is to identify where priorities should be placed and where to focus information technology investments.
Management Productivity Report
These forms assemble the variables needed to do Return-on-Management diagnosis. As a rule, accounting precision of the information is unnecessary until further analysis shows that a data element is critically important.EMPLOYMENT CHARACTERISTICS
Organizational Complexity is an indicator of the information required for internal and for external communications. Internal complexity is measured by counting communication layers between the Chief Executive and first level of supervision. When counting, the layers are inclusive of the starting level (e.g. CEO) and the recipient's level.External complexity is measured by counting the layers how far the Chief Executive is removed from the customer who ultimately consumes the product or service. If a business passes goods unchanged through distributors and then through retailers to a consumer, then the layers between the consumer and the CEO must be also counted. If, however, the distributor incorporates the product as a component within another product, then only the layers dealing with the distributor should be counted.
Workstations are an indicator of the extent whereto a business depends on electronic means for communications.
Working Hours are reported to make comparisons where different levels of productivity are shown because of different work practices.
The Employment Additions are used to calculate employee turnover rates. This is an indicator of the accumulated knowledge of a work-force.
THE MANAGEMENT OR OPERATIONS CATEGORIES
This distinction is the key to coming up with the measure of management productivity. The underlying concept here is that all costs essential for delivery of today's goods and services are classified as Operations. Everything else is automatically defined as Management. The Management function is seen as supplying the necessary support so that, Operations can deliver today's output to today's customers. The Management function also acts today so that, Operations can deliver tomorrow's output to tomorrow's customers.In this way of thinking Management, and not Operations are the engine that drives the future profitability in the same way as today's profitability is the result of yesterday's management efforts.
Management, and not Operations:
* Decide how to apportion revenue between suppliers, employees, shareholders and debt-holders.
* Allocate money between today's problems and tomorrow's opportunities.
* Choose and motivate employees. These are the paramount choices that make the difference whether a firm ultimately prospers or declines.
* Choose what markets to compete in, what prices to charge and what prices to pay for wages, salaries or purchases.
Management is the critical ingredient which makes the difference in delivering sustainable profits. A standard definition of the total costs of Management is a pre-requisite for computing a comparable measure of management productivity.
EMPLOYMENT TABLE
Classifying personnel into the Management or Operations categories will probably involve more discussion than any the other forms.Never start with an estimate of how many employees are involved in Management. Care should be taken to first identify only Operations. These are employees who can be directly and without much controversy associated with producing revenues. For instance, the hours used in machining, in assembly of parts, in taking telephone orders, in client billable time by a lawyer, etc., are clearly cases where Direct Operations personnel are involved.
The full time equivalent number of employees is computed by taking direct hours and dividing them by the net working hours as defined in the Working Hours characteristics. For instance, a factory operator delivering 1550 direct working hours per year (e.g., 1550 hours divided by 37.5 hours/week * 52 weeks less 6 weeks for vacation, paid holidays and absenteeism) would count as an equivalent 0.9 employee for Direct Operations. If the remaining 175 hours are spent in training and meeting attendance an equivalent 0.1 employees should be entered as Management.
If a consultant bills only 50% of his net available time (the remainder expended in training, marketing support and recruiting) then only 0.5 equivalent employees would be identified as Direct Operations. 0.5 equivalent employees would be entered as Management.
Do not classify all support functions as Management. For instance, in a warehouse the transportation dispatcher would be classified as Indirect Operations if his functions are essential for the goods to move out. Because the physical transportation adds to the value the customer is paying for, you can classify the actual time the transportation dispatcher spends in dispatching goods as Indirect Operations.
A billing clerk checking up whether the quantities on the loading dock correspond to the warehouse pick-list should be classified as Management, since checking for errors in warehouses I have ever seen is an avoidable managerial procedure. The billing clerks' time spent in checking for errors adds little value to what the customer is willing to pay for. In classifying personnel I take the position that all expenses for control, coordination, error checking, training, meetings and supervision are resulting from imperfections in Management processes and should be recognized .
Production equipment maintenance and computer operations personnel (in a commercial service bureau) who are essential for the production and services to continue without interruption would be also in Indirect Operations.
As a rule, if an individual is essential for the delivery of a revenue-producing product or service, the time spent on such efforts should be classified as Operations. If a job is dictated by internal needs, such as for innovation, for product development, for market research, for materials testing, for accounting, for personnel and for advertising then the person should be identified as Management because it is the purpose of management to take care of activities that will ensure the future of the enterprise. Special care should be taken to identify the large percentages of time expended by personnel, ordinarily viewed as Direct or Indirect Operations on managerial tasks such as meetings and in training.
Proceed in filling out the Employment Table form by first identifying all full time equivalent Operations personnel. The balance falls automatically into the Management headcount.
Remember: if you are not in Operations then you are in Management.
COST STRUCTURE TABLES
Purchases should include goods and services supplied by suppliers. This includes also goods and services got from other Divisions of the same company, if the purchases are made at competitive prices. Otherwise, all non-competitive internal procurement should be in Corporate Allocations, at an estimated market prices. Classifying Labor Costs should follow the rules outlined in filling out the Employment Table.
Attributing non-labor costs to Management is handled in the Management Support Costs schedule. The simplest approach in computing this allocation is to first estimate the % of Management cost to Total Labor Cost. This number can be then corrected for unusual costs, such as expenses for Corporate Headquarters, institutional advertising, pure research and personnel development.
A separate schedule is supplied to identify the costs of Information Technology. Good records are usually available to show what fraction of total Purchases, Labor and Other Costs are attributed to supporting Information Technology. The line item Management Support is to show what fraction of the total Information Technology expense is dedicated to Management functions.
(c) Copyright 1996, Strassmann, Inc.