|
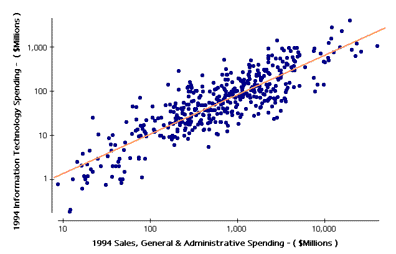
When management reviews a proposed computer budget, it is not very clever to
set it by some arbitrary rationale, such as requiring it to keep to a constant
percent of sales ratio, or increase only according to an inflationary cost
adjustment. The consequence of such rationing can be observed in many
organizations in the form of a steady leakage of computer budgets from where
they can be seen into categories which are hard to trace, such as into
consulting services, outsourcing contracts, software purchased as office
supplies and maintenance services performed by general administrative
personnel. In the past two years my surveys have shown that as much as 20% of
the officially reported computer budgets cannot be tracked.
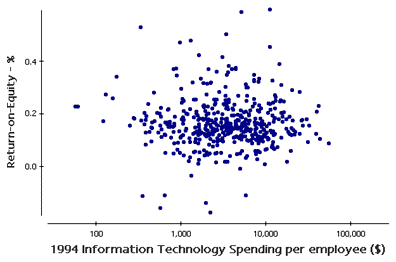
The budget for information technology is not determined by its Outputs,
such as profitability or revenues, but by its Inputs, as shaped by
organizational structure, the size of the corporate overhead, the opinions
about the benefits of computerization, the proliferation of personal computers
or the number of staff people.
Unless the proposed computer budget is clearly out of line with benchmark
spending, management would find it more rewarding to examine the causes that
drive information technology expenses instead of speculating about their
consequences. The information technology budget, in isolation, contains no
meaningful information by which some financial analyst could judge either its
utility or its size.
The primary focus for any reviews of information technology spending should be
the amount expended on Sales, General & Administrative line items.
If a company decides to employ additional accountants or financial analysts,
then the budget must provide for their computing sustenance, just as one
arranges for secretarial support, personnel services, furniture or telephones.
If there is a demand for computing services, there should be an efficient
supply to satisfy it. Manage the demand first and only then examine whether the
supply is efficient.
During the annual budget reviews the insistence that a chief computer executive
proves profit gains from the proposed computer spending is misplaced. Value
from information technologies can be extracted only by operating executives who
have harmonized their organizations to earn a profit in a competitive
marketplace. In that arena computers can certainly have a role to play,
sometime a leading one, but certainly not the decisive one, which is well
managed and well motivated people. A computer by itself is worth only its
resale or scrap price, which is not much.
Asking for a direct tie-in between increased funding for computers and a
commitment to deliver provable savings is an invitation to prepare figmental
projections that demean both those who produce them as well as those who accept
them. The value of an oil furnace is not in reducing fictional medical bills,
but the price of delivering reliable heat. During budget reviews management
must be first satisfied that operating executives have improved their
performance expectations because their plans are hinged on reliable computer
services. If such is the case then the examination of the efficiency of
delivering computer services becomes much easier. It is not the absolute amount
of money spent on the information technology budget that matters. It is the
full display of the life-cycle unit costs per seat for computer services that
would offer a tangible target for any budget probe.
A cost- and quality-focused review of the efficiency of proposed
computer expenditures can be accomplished by applying well-understood
value-engineering techniques. To address the broader questions of computer
effectiveness requires different metrics. The current approach of
treating computer expenses as a hard-to-budget overhead expense does not yield
satisfactory answers.
The expenditures for organizational development, meetings to assure
inter-departmental coordination, employee training, educating the customers,
securing cooperation from suppliers, satisfying government regulators,
conducting business process redesign and installing computers are claimed to be
among the leading means for achieving competitive superiority. Yet, very few of
these activities are ever measured in a consistent way. They are hardly ever
evaluated by means of generally accepted metrics.
Statements such as "...our employees are our principal assets," "...computers
are the company's strategic investments for the future ..."and "...we acquired
know-how for a premium price..." are empty gestures if they cannot be
enumerated.
Comptrollers require that the financial justifications of major applications
software development projects includes the calculation of a
Return-on-Investment . It assumes that each prospective gain in
knowledge how a company functions is a series of isolated happenings. It treats
each software investment as if it was a machine with a defined amortization
schedule. Yet, the knowledge and skills of a workforce that has become
accustomed to doing business by means of computers is a continuum. The effects
of increased computerization can be only observed and measured as gains in
overall business performance.
The fault with the current approaches to investment analysis of business
automation lies in a two hundred year bias that favors capital as the measure
of all performance. According to this deeply embedded view, what matters is the
efficiency with which capital is deployed. Annual reports will prominently
display trends in Return-on-Equity. Executive bonus plans will be tied
to achieving Return-on-Assets targets. Finance committees will require a
favorable Return-on-Investment figure for all projects. Insofar as the
contributions of people, information and knowledge are concerned, the financial
statistics remain silent because none of these contributions to creating a
greater economic value are recognized in generally accepted accounting
procedures.
The fact is that the costs of information have long ago surpassed the costs of
equity capital. Capital, in its various forms, is now a commodity, which can be
easily borrowed, leased, subcontracted or outsourced for a price. Except for
some firms, such as in steel, mining, transportation or real estate, the
scarce commodity is information. It is through effective information management
practices that the users of information - the managers of a firm - create all
business value. I have studied the costs of management, or costs of overhead,
for more that twenty years and have found that what corporations report as
Sales, General & Administrative expense is a reliable - if modestly
understated - approximation of overhead costs obtained by means of a more
exhaustive analysis.[2] The following is a
diagram showing the distribution of the ratio of management information costs
(e.g. S.G.&A) to the annualized costs of equity capital for 2,959
US corporations.[3]
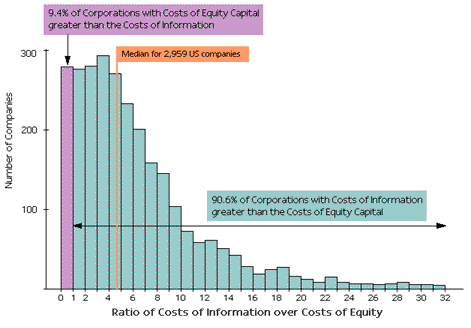
It is a surprising diagram. Only 9.4% of the corporations are
capital-intensive. The remaining corporations are information-intensive, with
the median value of 472% and ranging as high as 3,200% for a consulting firm
that has practically no assets, but an enormous overhead. There are many ways
of interpreting the significance of this distribution, but what stands out is
the confirmation that management - the processors of all information - now have
a much greater stake in a business than shareholders. It also demonstrates that
the capital-based industrial economy has been superseded by the
managerial-dominant information economy.
Is the information-intensity of the US corporations an aberration? Here are
summary statistics for other economically advanced countries:
     # of                     Median       % of Firms
  Companies    Country       Info/Equity  with Info > Equity
                               Ratio
     123       Germany         1,046%       94%
     162       Italy             528%       91%
    2959       USA               472%       91%
    1175       U.K.              465%       86%
    1768       Japan             407%       95%
     120       Switzerland       379%       87%
     308       Canada            158%       60%
With the exception of Canada - a country that depends on natural resources for
sources of much of its wealth - the information over equity ratios are not
dramatically different for other countries as well.[4]
The greater importance of information expenses than the costs of shareholder
equity bring into question the validity of metrics such as
Return-on-Equity, which is a frequently used indicator of corporate
performance. Return-on-Equity measures the productivity of how well
shareholder capital is put to use. However, if equity capital is not very
significant as an Input to a corporation's Output and if it can
be substituted through loans that make it a commodity-like item, then continued
reliance on this a similar capital-based ratios may not reflect what are the
most important ingredients of corporate success.
The lack of relevance of equity-based ratios is also revealed in the large
differences between the accounting definition of shareholder equity and its
stock-market valuation. Investors often pay large multiples of the accounting
valuation to acquire a controlling shareholder position. By paying a premium
over "book" value of shareholder equity, the investors recognize that it is the
productivity of information that shapes the value-creation capacity of an
information-rich enterprise. Investors understand that what matters is the
productive capacity of the accumulated information resources, except that the
accounting reports remain silent about that.
Measuring the productivity of information in an information-based enterprise is
necessary for steering it. If you cannot measure it, you cannot tell if you
improved it. If you do not know where you are, a long-range plan will not be of
much help.
All measures of productivity are defined as the ratio of Output/Input.
The fault with the existing measures is that they determine Output in
terms of accounting profits, as defined by generally accepted Financial
Statements. Input is defined by what is reported on the Balance
Sheet .
For example, the Return-on-Equity would define the Output of a
firm as Profit after Taxes, even though this does not include any
compensation to the shareholder's for their equity. The Profit after
Taxes would be then divide that by Shareholder Equity as the only
critical Input. As illustrated above, the Shareholder Equity is
not a critical resource. The Return-on-Equity ratio cannot be a good
indicator of performance since the numerator that does not fully account for
all of the costs and the denominator includes less than 10% of what makes a
company profitable.
Accounting rules do not accept that an information-productive corporation can
convert a stream of information expenses into earnings or an asset. Information
is treated as an instantly perishable commodity. Lenders like this approach
because it tells them what is the likely salvage value of a firm if it fails
and the employees abandon it. In contrast to this view of a firm as a corpse,
information productivity metrics will suggest an examination of the living
worth of organizations who have learned how to function within their
competitive arena.
To measure the effectiveness of management calls for adding to our portfolio of
metrics two new productivity ratios. For each of these measures the
Outputs will be defined as the Management Value-Added and the
Inputs as the Costs of Management.
Management Value-Added is what is left over after absolutely all costs
are fully accounted for. This calls for subtracting from the Profits after
Tax an allowance for the costs of shareholder equity as well as other
adjustments to correct for accounting peculiarities largely influenced by the
tax code. The costs of shareholder equity is obtained by multiplying the
Shareholder Equity shown on the Balance Sheet by the costs of
shareholder capital.[5]
Rigorous cost analysis is necessary to isolate all expenses that cannot be
directly attributed to the delivery of goods or services to customers and then
designate them as the Costs of Management. Another way of obtaining
identical results is to first identify all direct costs of goods and services.
Whatever is left over can be then assigned as the Costs of Management.
Both methods are painfully labor-intensive. Both methods run into difficulties
from those who find it expedient to attribute their own overhead expenses to
where they would be recorded as an allocated element to the direct costs of
good and services.
Nevertheless, several hundred organizations have examined their full costs of
information-related activities, including the costs of coordination, meetings,
secretaries, consultations, interviews and every other activity that is not
directly related to delivering what a customer wishes to purchase.
I have designated the ratio that fully accounts for the Management
Value-Added as well as all of the Costs of Management as the
Return-on-Management productivity index, or R-O-M.
There is a way of approximating the Return-on-Management productivity
measure by accepting the reported costs of Sales, General &
Administrative expenses as a fair estimate of the Costs of
Management. That becomes the Information Productivity index. Its
overwhelming advantage is that it is usually available from public sources as a
certified accounting entry. It makes possible quick and preliminary estimates
of productivity. It bypasses, at least initially, disputes about what are
the Costs of Management
To evaluate the effectiveness of the use of information resources one should
start by ranking a company's Information Productivity against the
performance of similar corporations.[6] To
select the right group for benchmarking comparisons I look for corporations
that are of a comparable size, operating under similar competitive
circumstances and carry related SIC (Standard Industrial Classification)
designations. Such information is available from commercial data bases. To
illustrate such a ranking I have chosen the pharmaceutical industry ( all data
in local currencies, for 1994):
         Company           SIC       Equity        Income         SGA          IP(TM)
    MERCK & CO., INC.      2830    11,139,000    2,997,000      4,408,100      0.415
   ABBOTT LABORATORIES     2830     4,049,400    1,516,683      3,017,971      0.362
 LILLY (ELI) AND COMPANY   2834     5,355,600    1,286,100      2,295,400      0.315
     SCHERING-PLOUGH       2830     1,574,400      922,000      2,448,900      0.309
  AMERICAN HOME PRODUCT    2830     4,251,910    1,528,178      3,992,774      0.271
    BEECHAM GROUP PLC      2834     1,491,500      239,400        388,900      0.213
   PFIZER INCORPORATED     2830     4,323,900    1,298,400      4,390,200      0.192
    ROCHE HOLDING AG       2834    16,422,000    2,860,000      7,218,000      0.157
     WARNER-LAMBERT        2830     1,816,400      694,000      3,250,600      0.155
    PROCTER & GAMBLE       2834    10,410,000    2,543,000      9,632,000      0.151
        SANDOZ AG          2834     6,887,000    1,734,000      7,229,000      0.140
    ZENECA GROUP PLC       2834     1,685,000      443,000      1,951,000      0.136
   SMITHKLINE BECKMAN      2830     1,546,700      229,200      2,221,800      0.030
     SANKYO COMPANY        2834   341,178,000   39,155,000    190,225,000      0.018
        BAYER AG           2834    16,602,000    1,970,000     14,654,000      0.015
   SMITHKLINE BEECHAM      2834       549,000       72,000      2,790,000      0.005
        SANOFI SA          2834    17,359,000    1,328,000     11,237,000     -0.044
     TAKEDA CHEMICAL       2830   645,401,000   51,430,000    257,222,000     -0.064
    RHONE-POULENC SA       2834    32,496,000    1,915,000     21,163,000     -0.071
It
is important for the top management of a firm to understand their relative
productivity ranking, because the information management initiatives they may
need will differ. For instance, high productivity companies will find it always
difficult to sustain their superior standing. They should be willing to accept
information-related investments that offer high-payoff opportunities, even
though that may involve taking high risks. Companies with a negative
Information Productivity rank will have to accept a highly conservative
approach in selecting information systems projects because they cannot afford
many failures.
An Information Productivity ranking should be seen as a start in search
of finding out whether or not information technologies are "aligned" with the
business of the firm. In more than half of the low-productivity cases examined
in the past eleven years it was not a poor choice of technology that explained
why information productivity performance was substandard. Corporations
suffering from a case of negative Information Productivity either have
"congested arteries" (e.g. excessive S.G.&A) or "excessive weight" ( e.g.
excessive assets). A further investigation into the probably causes of low or
negative Information Productivity will usually result in a fairly good
estimate of the priorities and worth of potential information management
projects.
It is possible to show major shifts in the annual Information
Productivity rankings. Dramatic reductions in Sales, General &
Administrative expenses - the favorite killing fields for reengineering
programs - may show up as spectacular gains in the following year, especially
if the cost reductions take place during a period of economic prosperity.
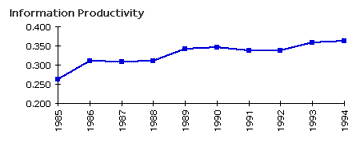
However, what matters is the capacity of a firm to sustain and grow its
productivity achievements over an extended time period. An examination of
Information Productivity results is not complete without showing a
track record that spans at least one business cycle. I shall use Abbott
Laboratories financial data to illustrate and example of superior and sustained
growth of Information Productivity for a ten year period:
Keeping track of Information Productivity for every operating unit of a
firm will offer a better way of measuring the contributions of decentralized
units and offer more sensitive indicators that would warn about adventures that
trade long term results against current accounting profits.
Information Productivity makes possible the compilation of international
productivity comparisons. These are largely immune from the bias that is found
in productivity claims coming from the economic agencies of various national
governments.
The following tabulation shows the results extracted from a global data base of
audited financial statements for 1994. The companies making up the sample
adhered to standards largely conforming to generally accepted US accounting
principles:
                 Companies     Total Revenues    Weighted
    Country     in Database       (US$000)       Average IP(TM)

     SWEDEN          24            75,540,278      0.117
    FINLAND          57            58,337,766      0.078
    IRELAND          48            20,526,573      0.077
 UNITED STATES    2,959         4,839,398,019      0.077
  NETHERLANDS        78           321,808,668      0.066
     NORWAY          65            28,838,430      0.042
 UNITED KINGDOM   1,178         1,032,147,384     -0.032
    GERMANY         123           650,231,734     -0.036
   AUSTRALIA         20            25,393,032     -0.119
 KOREA (SOUTH)       41           113,933,255     -0.120
    BELGIUM          23            17,921,628     -0.128
     FRANCE         124           511,606,973     -0.145
    DENMARK          78            45,369,476     -0.159
     JAPAN        1,767         5,233,053,608     -0.170
     ITALY          161           346,779,093     -0.214
     BRAZIL          33            60,641,605     -0.346
     CANADA         311           265,364,969     -0.367
     MEXICO          30            28,921,380     -0.619
  SWITZERLAND       108           244,267,380     -0.689
                  -----        --------------
                  7,228        13,920,081,251
The 7,228 companies in this tabulation account for $13.9 trillion of revenues,
which represents perhaps a fourth of the world's productive capacity. It is
surprising that the US ranks high above Japan in Information
Productivity. This supports one view that whatever gains the Japanese make
in their factories, they may lose in their offices. The low productivity of
Switzerland is largely explainable by their reliance on ample equity capital
for the generation of revenues.
It is no longer necessary to rely exclusively on capital-based productivity
indicators, such as ROE, ROA or ROI to judge the health of a firm. Many of the
new high growth ventures, such as in the media, software, professional services
have long abandoned valuations based on these measures which applied to the
capital-intensive manufacturing enterprises of the industrialization era. The
new and information-intensive segments of the economy are ready to receive new
ways for tracking and evaluating their results.
As knowledge-based organizations increase their share of resources devoted to
information management it becomes prudent to adopt new metrics for evaluating
operating results. Information-based productivity ratios, such as the
Return-on-Management (R-O-A) or Information Productivity (IP)
indices are especially sensitive in diagnosing deficiencies that otherwise
could remain hidden without a measure that surfaces their effects. The
Information Productivity measures of firms such as AT&T, Xerox, IBM and
General Motors started into a nose-dive years ahead of their decline as
reported by their published financial statements. All of these firms declared
profits and paid bonuses even through the Information Productivity index
turned negative - a sure sign that corporate management was not delivering a
positive Management Value-Added.
There is ample evidence now that corporations employing identical land,
identical labor force, identical computer technology or comparable amounts of
capital assets deliver vastly different financial results. That largely holds
true regardless of the form of government, national culture or taxation.
Therefore, the only difference that makes a difference must be the skills and
capabilities of management. For this reason all value creation in an
information-based enterprise must be attributed to management who coordinate,
motivate, lead and organize resources. If the Information Productivity
metric is taken up by Boards of Directors as one of the metrics by which to
judge managerial performance, many corporations now reporting accounting
profits may have stop heaping more rewards on management.
Information-based productivity ratios also offer the potential of giving to the
public sector better metrics for tracking their often claimed, but never proven
improvements. Information Productivity is applicable to assessing the
ratios of Outputs to information Inputs in the public sector
where conventional techniques reveal only costs and but do not measure the
results in a consistent manner.
For example, I have counted how many people in the Pentagon, contractors,
clerks, communications specialists, auditors, congressional committee staffs,
inspectors, comptrollers, accountants, quality assurance engineers, public
relations officials and experts of all sorts (e.g. Costs of Management)
were engaged in minding what a single soldier was doing while in the harms way
(e.g. delivering Management Value-Added).
Similar statistics are now available for a number of public institutions, such
as the New York City Board of Education. It reveals how many dollars of
management are necessary to deliver a single dollar's worth of teaching in
front of a classroom of pupils. While everyone is complaining about
"bureaucracy" more could be accomplished by asking for evidence of
Information Productivity gains every time a public agency requests
additional funds.
Information Productivity analyses have opened new avenues for exploring
issues that have been debated endlessly without facts that could be checked by
everyone. For instance, is there such a thing as the much talked about
"productivity paradox" that investments in information technologies have not
shown up as yet as gains in the aggregate economic productivity? My
Information Productivity studies suggest that there is not a shred of
evidence that massive investments in information technologies have increased US
productivity performance. The best one can say is that computers may have
prevented further deterioration than would have otherwise taken place.
Another question that puzzles legislators concerns the productivity of small
businesses. Are small business more productive than large corporations? My
Information Productivity studies show that very small businesses show a
poor average productivity because of their high failure rates. Once a
corporation reaches a critical size, in the $100 million per year range, its
productivity becomes extraordinary, it is a source of employment gains and
becomes a heavy investor in innovation. As corporations grow from large to very
large, their average productivity declines severely. The overall poor
productivity performance of the US over the last decade has been largely caused
by huge losses from a handful of giant corporations that account for a
disproportionate share of employment and economic value-added of this country.
The Information Productivity ratios have the advantage that they are
derived from audited public databases, reporting the results produced from
individually identified firms. Information Productivity analyses are
applied micro-economics using good and verifiable data. In contrast to that,
public policy discussions about productivity are based on Government statistics
that are admittedly incomplete, of questionable applicability to
information-intensive enterprises and subject to incomprehensible "adjustments"
to account for changes in prices and policies.
The calculation of the Management Value-Added makes it possible to
count the worth of the people who possess the accumulated knowledge about a
company. These are the carriers of Knowledge Capital(TM). They are the
people who leave the workplace every night and may never return while storing
in their heads knowledge acquired while receiving full pay. They possess
something for which they have spent untold hours listening and talking while
delivering nothing of tangible value to paying customers. Their brains have
become repositories of an accumulation of insights how "things work here" -
something that is often labeled by the vague expression "company culture."
Their heads carry a share of the company's Knowledge Capital, which
makes them a shareholder of the most important asset a firm owns even though it
never shows up on any financial reports. Every such shareholder of Knowledge
Assets in fact becomes a manager, because information acquisition and
information utilization are the essence of all managerial acts.
The term "management" is used here as applicable to every information activity
that is not directly engaged in the generation of revenues. I define customers
as the people from whom you collect cash.[7]
If a newly-hired factory worker spends half a day in general orientation and
indoctrination meetings, that makes him partake in a managerial activity. The
work of an executive secretary can be also seen as managerial, since this job
involves information gathering, storage and dissemination tasks. Meetings,
training, consultations, giving advice, accounting, administration,
interviewing or correcting quality defects by this definition are all
managerial functions because if they would be fully accounted for, they would
be charged to "overhead" and not to direct costs of sales.
In a typical company an average employee spends at least one third of their
time acquiring intra-company information that is unrelated to the delivery of
goods or services. Employees in managerial and staff position expend all of
their time on tasks not directly related to the delivery of goods or services.
More than 25% of payroll dollars in an information-intensive enterprise, and
well over 50% of the payroll dollars in most government agencies, are expended
on information activities that should be recorded as managerial overhead.
All of this learning, talking and listening costs money. If that accumulation
is ultimately convertible in greater productivity for the enterprise, then the
expense was worth it by earning a return on the Knowledge Capital
investment.
Consider the costs of managerial knowledge accumulated by an employee over a
ten year period. With full costs of employment at about $60,000 per annum, the
decade-long exposure to managerial information would result in knowledge
Inputs costing about $150,000. What would be then the measurable
Outputs from all of that accumulated knowledge?
The Management Value-Added has been previously shown as the net result
of all managerial activities. Management Value-Added is the net surplus
economic value created by the firm, since the suppliers, the tax authorities,
all labor, and all shareholder expenses have been already fully accounted for.
The creation of Management Value-Added is something that defies the laws
of conservation of energy. These laws state that Output of any system in
the Universe can never be greater than its Input. Delivering a positive
Management Value-Added must be therefore an act of creativity that
springs forth from something that is intangible, as if it were an artistic
conception. The source of this creative energy is Knowledge Capital
which can be quantified only indirectly by observing how much Management
Value-Added it yields.
Another way of looking at the same phenomenon is to infer the value of
Knowledge Capital from its periodic yield. If Management
Value-Added is the interest earned from an accumulation of knowledge
residing with the firm, then the value of this principal can be calculated by
dividing the Management Value-Added by the price one pays for such
capital.
Mergers and acquisitions of companies have made the pricing of all capital
explicit. It is the risk-adjusted interest that an investor is willing to pay.
Since investors cannot differentiate between the price of capital for financial
or knowledge investments because they are intermingled, I use the identical
price for all capital as a first approximation. This yields a simple
equation:
Knowledge Capital = Management Value-Added / Price of Capital
This relation makes it possible to prepare a revised Balance Sheet for
any firm, by adding a line item Knowledge Capital on the Asset
side of the ledger, and by increasing (or decreasing) the reported valuation of
Shareholder Equity by the identical amount.
To carry on with an examination of Abbott Laboratories, the following chart
shows how their accumulated Knowledge Capital compares with
Shareholder Equity for a period of ten years:
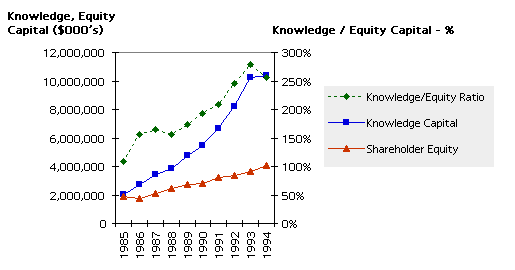
Abbott Laboratories is an example of a company that has successfully kept
accumulating Knowledge Capital faster than Shareholder Capital.
Its earning capacity and productivity is gaining not because they are hoarding
financial assets, but because they are using the capabilities of their people
more effectively.
A great deal of investment analysis is concerned with indicators such as the
Market-to-Book ratios, where the term Book Value refers to the
Shareholder Equity. Stocks are thought to be overvalued if the Market
Value of shares rises materially above a trend line for the Book
Values.
In the chart below I am showing a plot of a three-year moving average of the
ratio of Market Value to either Shareholder Equity or to
Shareholder Equity plus Knowledge Capital for Abbott Laboratories.
According to the traditional Market-to-Book valuation method, an
investor may have started worrying in 1991 that the shares of Abbott
Laboratories were overpriced. However, if the investor would plot a three-year
moving average of Market -to Book plus Knowledge Capital , the stock
would be seen as priced fairly:
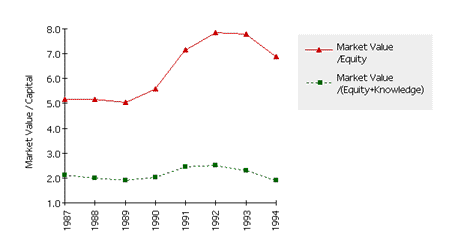
The sustained stability of the Market-to-Capital ratio which accounts
for the steady rise in the Knowledge Capital of Abbott Laboratories
confirms that the stock market will recognize the accumulation of knowledge as
an asset even though the accountants do not. The stock market will also reward
the accumulators of Knowledge Capital because investors recognize that
the worth of a corporation is largely its management, not its physical or
financial assets.
I have analyzed a number of corporations using this method and find that adding
Knowledge Capital to book value Equity Capital shows a good
correlation with the prices investors are willing to pay for shares of
information-intensive enterprises.
One can view Knowledge Capital as the result of a stream of expenses
that have aided an organization to become more effective over a period of many
years. Meetings are not necessarily wasted, because they may contribute to
greater employee awareness. Training is useful if it is put to good use by
making it possible to reach higher levels of quality and productivity. Software
can become immortal if it is not discarded, but reused over and over again.
Almost everything that counts as an accumulation of knowledge is usually paid
for and written off as an overhead expense and charged against current profits.
This can decreases profits, increases expenses and diminish Information
Productivity unless management sets out deliberately to treat all overhead
expense as a potential investment in Knowledge Capital. Every manager
should therefore monitor what portion of their Sales, General &
Administrative expense is frittered away as a one-time happening and how
much of it can be seen as an asset with a residual value.
In the case of Abbott Laboratories, that is an important question since more
than a half of its stock value is derived from its gains in Knowledge
Capital. The answer can be found in computing the firm's
Overhead-to-Asset Conversion Efficiency.
The ten year sum of all Sales, General & Administrative expenses for
Abbott Laboratories adds up to $18.9 billion. During that period Knowledge
Capital has grown by $8.6 billion. This the defines the
Overhead-to-Asset Conversion Efficiency as 44.3%. It means that
slightly less than a half of overhead expenses has been well expended for the
benefit long-term utility. A way of displaying this steady trend is shown in
the following chart:
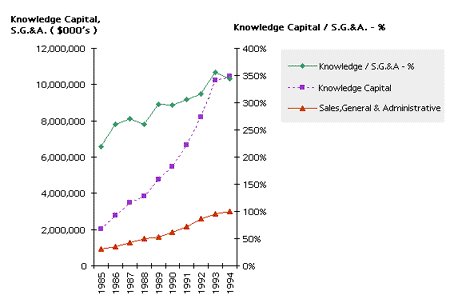
The Abbott Laboratories have succeeded in generating Knowledge Capital
faster than its S.G.&A. They are highly profitable because their
accumulated knowledge can be reapplied without further expense. Their current
S.G.&A. is indeed lower than most of their competitors, because they do not
have to pay for all of it in every fiscal year. They re-cycle S.G.&A at a
very low cost, which saves on expenses and increases the value of each
employee. [8]
I have analyzed the Overhead-to-Asset Conversion Efficiency of hundreds
of companies and found that a surprising number of companies suffer from a
negative conversion efficiency. As they cut S.G.&A. during re-engineering,
their long-term Information Productivity(TM) declines because their
attrition of Knowledge Capital proceeds at a faster rate than the
savings generated from wholesale dismissals of people. There seems to be a
trade-offs between indiscriminate cost-cutting and the demoralization of
valuable employees that leads to a suicidal death spiral.
One of the most efficient instances of Overhead-to-Asset Conversion
Efficiency is the Microsoft Corporation. In the period from 1986 through
1995 it gained $8.3 billion in Knowledge Capital while expending only
$10.5 billion for S.G.&A. To explain Microsoft's extraordinary
Overhead-to-Asset Conversion Efficiency of 79% one has to understand
that Knowledge Capital does not need to reside exclusively in the heads
of employees. It also occupies the mind-share of customers who have expended
their own time and money to became habituated to Microsoft products.
Over 40% of all computer budgets is expended on software "maintenance." This
involves continuous refurbishing of old programs. It consumes large amounts of
money to repair poorly designed and badly organized translations of business
processes into software code.
An additional 10% of all computer budgets is expended on new projects. A close
examination of proposals will show that much of the financial justification for
starting anew is to reduce expenditures for maintenance. If someone would try
to sell a house that requires an annual upkeep equal to a half of the purchase
price, nobody would buy it. A rapidly deteriorating capital asset is not worth
much. Yet, the very high ratio of life-cycle maintenance costs to the original
acquisition cost demonstrates that today's application software is one of the
flimsiest artifacts that management will ever buy.
The idea of constructing software to qualify as a high-residual value,
low-maintenance capital asset has never been accepted. Just as in the story of
the three little pigs, management does not have the patience to invest in an
architecture that is survivable in the long run. The computer people, the
vendors and the consultants also prefer whatever is new, fashionable and
quick.
The reason for the flimsiness of the application software can be found in the
lack of understanding by most executives that software has become an
increasingly significant store of a corporation's Knowledge Capital.
While a comptroller may question the trade-in value of fork-lift trucks, when
it comes to software it will be written off without any examination as to its
reuse. Software expenses are now wasted because management uncritically accepts
the view that software is largely unrecoverable every time technology,
organization or business practices suffer from major changes.
The existing methods of accounting do not recognize that for most corporations
the accumulation of expenditures for software over a ten year period will
exceed the value of Shareholder Equity in about 30% of cases. As long as
software is treated as an expense that must realize short-term returns,
corporations will be paying for software that performs similar business
functions many times over without the benefit of any reuse.
Software asset management is perhaps one of the most exciting new opportunities
for accelerating the accumulation of Knowledge Capital because it
represents an encapsulation of accumulated expert knowledge that can be
purchased in the open market at a fraction of its original cost.
Software should be seen as one of the best means for accumulating and
preserving enormous amount of information about the ways how a corporation
functions. It should be recognized as a knowledge asset so that it can be
managed as something that keeps accruing value steadily, reliably and safely.
It must be designed for evolutionary growth instead of keeping it alive by
patching it up until such time when a sudden convulsion makes it necessary to
replace it without much delay.
Management must insist that applications software is preserved by means of
technical designs that accommodate rapid changes in computer technologies.
Management should demand delivery of software applications that take advantage
of innovations in operating systems, that adapts to revisions in organization
structure and takes advantage of any streamlining of business practices
If a company scraps 100 fork-lift trucks before they are depreciated, that will
be recorded as a loss. If 1,000 employees with career-life learning costs of
at least $150 million leave a corporation, none of the financial reports will
reflect that. When knowledgeable employees leave, they are written off having
no value even though during their years of employment the corporation paid for
all of the knowledge they acquired on the job .
The existing methods and concepts of accounting, budgeting and planning are
biased against anything that is not a tangible asset. No wonder that many prior
attempts to calculate the productivity of "information" have foundered on the
reluctance of the current stakeholders to be subjected to the sort of
measurements that were previously reserved only for the laboring classes.
The reasons for the preservation of accounting methods that were suitable for
the industrial era is for students of corporate power politics to debate.[9] It should suffice to remind us that when
industrialization induced a shift from the extraction of funds from feudal land
possessions to earning profits on invested capital, most of the assumptions how
to measure performance had to change. When the expenses for acquiring
information capabilities cease to be an arbitrary budget allocation and become
the means for gaining Knowledge Capital, much of what is presently
accepted as management of information will have to shift from a largely
technological view of efficiency to an asset management perspective.
Profitability and spending on computers are unrelated because they are
influenced by the way a company is organized and managed and not by the choices
of technology. Looking for a "technology fix" to problems that are
fundamentally managerial must end up in failure.
Most of information technology is used in the support of overhead functions.
Budgeting of computers should take place only after business processes have
been simplified and information management has been made more effective.
Information costs are larger than capital costs. Therefore, conventional
measures of capital productivity, such as calculating the ROA or ROI of
information systems investments are inadequate in assessing the effects of
improvements in information management.
Information productivity can be measured. That requires attributing to
management the credit as well as the blame for all results. Information
productivity evaluations offer a useful metric for assessing the performance of
local units both in the private and public sectors.
Knowledge capital must be counted. Without considering the effects on the
knowledge accumulated in the heads of employees, suppliers or customers, all
other performance indicators remain incomplete and inadequate for judging the
capabilities of an organization.
|
